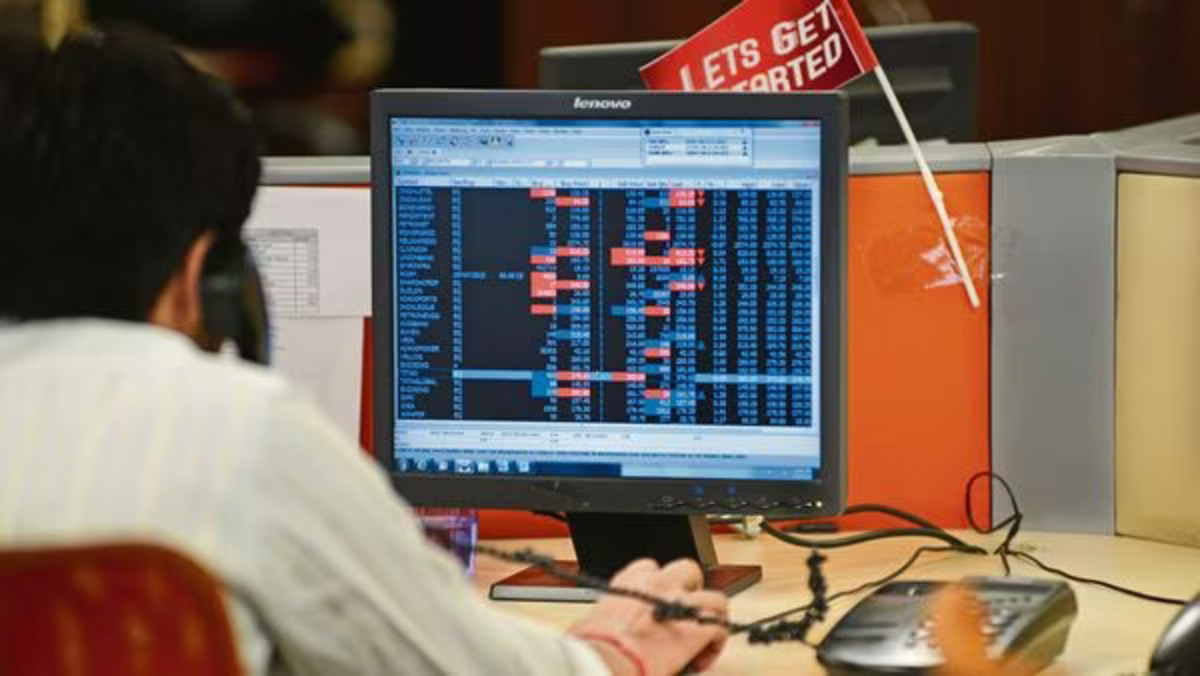
the Indian stock market’s performance on October 10, 2023. Despite geopolitical concerns, the Nifty 50 and Sensex are poised for a positive start. Get insights into technical analysis, support, and resistance levels for Nifty 50 and Bank Nifty. Keep a close watch on market trends as you navigate today’s trading session.
Investors and market enthusiasts are gearing up for another day of trading as they closely monitor the performance of the Indian stock market indices, namely the Nifty 50 and Sensex, on October 10, 2023. The financial landscape is influenced by a complex web of factors, including global economic trends, geopolitical events, and domestic economic indicators. In this article, we will delve into the specifics of what to expect from these indices in today’s trading session.
Despite lingering concerns surrounding the Israel-Palestine conflict, there is a glimmer of optimism as the Indian stock market is poised for a positive start. This optimism stems from gains observed in Asian markets, which have had a positive ripple effect on investor sentiment. The early market trends are pointing towards a gap-up opening for the Indian benchmark index. As of now, the Gift Nifty is trading at approximately 19,615, comfortably exceeding the Nifty futures’ previous closing level of 19,522.
To gain a deeper understanding of the potential market movements on October 10, it’s essential to reflect on the events of the previous trading day. Monday saw both Sensex and Nifty 50 experience a notable decline, marking the end of a two-day winning streak. The primary driver behind this downward movement was the ongoing geopolitical tensions in the Middle East, specifically the Israel-Palestine conflict. The Nifty 50 recorded a substantial 141-point drop, closing at 19,512.35, while the Sensex concluded the day with a 483-point decrease, settling at 65,512.39.
Taking a closer look at the technical aspects, the daily chart for Nifty 50 revealed the formation of a small negative candle featuring an upper shadow. Nagaraj Shetti, a Technical Research Analyst at HDFC Securities, interprets this pattern as indicative of a lower top formation in stock prices. He suggests that this pattern creates an opportunity for traders to ‘sell on the rise’ and implies the potential for short-term weakness. However, it’s worth noting that Shetti also observed the persistence of a bullish hammer candle pattern on the weekly timeframe chart, indicating a level of optimism in the market.
Now, let’s break down the expectations for Nifty 50 and Bank Nifty in today’s trading session:
Nifty 50:
The decline witnessed in the Nifty 50 on Monday can be attributed to investors adopting a risk-averse approach, primarily driven by the prevailing geopolitical tensions in the Middle East. Rupak De, a Senior Technical Analyst at LKP Securities, pointed out that on the hourly chart, the 200-day Simple Moving Average (SMA), positioned around 19,670, played a crucial role as a resistance level during Friday’s trading session, ultimately contributing to the index’s decline. De anticipates that support levels can be identified in the range of 19,480 to 19,430. He suggests that the market might continue to display a’sell on the rise’ sentiment unless Nifty manages to surpass the 19,700 level.
Bank Nifty:
Bank Nifty, on the other hand, faced substantial selling pressure on Monday, leading to a decline of 474 points, with the index closing at 43,887. According to De, the index remains below the critical 44,000 level, which indicates the likelihood of ongoing weakness in the short term. Immediate support levels are expected to be situated in the range of 43,800 to 43,500 on the lower end, while resistance is positioned at 44,000 on the higher end.
While the specter of geopolitical tensions remains a pressing concern, market experts and traders are cautiously optimistic about the prospects for the Indian stock market on October 10, 2023. However, the nuances of market sentiment, along with the support and resistance levels mentioned above, will play a crucial role in determining the direction of market movements during the trading session. As always, investors are advised to remain vigilant and adapt their strategies in response to real-time developments in the financial landscape.
Disclaimer: The views and recommendations made above are those of individual analysts or broking companies, and not of stretchfacts.com. We advise investors to check with certified experts before making any investment decisions.
also read Adani Group
